
Strategy/Metrics and Targets
Strategy
In considering climate-related risks and opportunities, the Company has prescribed the following time frames of short, medium, and long term.
Definition of time frames for the consideration of climate-related risks and opportunities
The table below can be scrolled horizontally.
| Short term | Medium term | Long term |
|---|---|---|
| 2023 - 2026 | 2026 - 2030 | 2030 - 2050 |
In each time frame, we considered and identified risks and opportunities based on the TCFD recommendations. We also ascertained the quantitative impact by referring to the parameters of several climate-related scenarios. The impact is greater in the referenced scenarios when the temperature rise is smaller in the case of transition risks, and when the temperature rise is larger in the case of physical risks. Therefore, to avoid underestimating the impact, we applied the 1.5℃ scenario to the transition risks, and the 4℃ scenario to the physical risks.
The table below can be scrolled horizontally.
| Assumed temperature rise | Cited scenario |
|---|---|
| 1.5℃ | Net Zero Emissions by 2050(NZE2050)scenario Source: World Energy Outlook (WEO) 2023, International Energy Agency (IEA) |
| 4℃ | RCP(Representative Concentration Pathways)8.5 Source: Fifth Assessment Report of the Intergovernmental Panel on Climate Change (IPCC) |
Main climate-related risks and opportunities identified by the Company
The table below can be scrolled horizontally.
| Type of risk or opportunity | Overview of the Company’s risks and opportunities | Degree of impact | ||
|---|---|---|---|---|
| Risks | Transition risks | Policy and legal | Increase in costs due to strengthening of regulations on GHG emissions such as carbon tax (carbon pricing) | Significant |
| Market | Loss of growth opportunities due to delays in responding to market changes such as increasing demand for environmentally conscious merchandise | Medium | ||
| Reputation | Decline in reputation due to insufficient response to climate change or disclosure | Medium | ||
| Physical risks | Acute | Decrease in sales due to direct damage to stores and impact on distribution routes from intensified damage caused by storms and floods arising from global warming | Significant | |
| Chronic | Rising energy costs due to an increase in the number of extremely hot days arising from global warming, and lower productivity due to heat stroke and other harmful effects on employees’ health | Medium | ||
| Opportunities | Resource efficiency | Reduction of cost and emissions through improvements in transportation efficiency (consolidation of transportation networks, shared use of vehicles with other companies, etc.) | Medium | |
| Market | Increase in sales through appropriate response to market changes such as increasing demand for environmentally conscious merchandise and emergency kits | Medium | ||
The Company believes that appropriate actions against risks will lead to opportunities as demonstrated above by the potential for demand for environmentally friendly merchandise to increase in cases of both risks and opportunities. We will strive to capture growth opportunities by proactively working against climate-related risks.
Financial impact due to risks and opportunities, and countermeasures
1. Transition risks and opportunities
Out of the identified transition risks and opportunities, the Company considers the increase in cost arising from the strengthening of regulations on GHG emissions such as carbon tax (carbon pricing) in Japan as a factor that has an especially significant impact on us. To gain a quantitative overview of such an impact on the Group, we prepared estimates by citing the carbon price as of 2030 presumed in the 1.5℃ scenario under the Net Zero by 2050 (NZE2050) scenario defined in World Energy Outlook (WEO) 2023.
Assumed impact on the Group in 2030
The table below can be scrolled horizontally.
| (1) Carbon tax price (thousand yen/t-CO2) |
(2) The Group’s emissions (t-CO2) |
Cost increase due to carbon tax (1) × (2) (thousand yen) |
|---|---|---|
| 21.0 | 134,711 | 2,828,931 |
- Preconditions for estimates
- Carbon tax price: US$140/t-CO2 (exchange rate of US$1 = 150 yen)
The NZE2050 scenario in WEO 2023 cites the carbon tax price of US$140/t-CO2 for Advanced Countries with Net-Zero Commitments as of 2030. - The Group’s emissions: The Group’s total Scope 1 + Scope 2 emissions in FY2024
- Carbon tax price: US$140/t-CO2 (exchange rate of US$1 = 150 yen)
As a result of the estimation, we recognize the risk of incurring an additional cost of approximately 2.8 billion yen.
- Countermeasures against risks
- Given the importance of reducing emissions, the Company will reinforce measures to do so by continuing with conventional energy-saving measures at stores (such as introducing LED lighting systems and other highly efficient equipment and energy management systems), alongside efforts to use renewable energy. (As a part of these measures, we introduced electric power generated by renewable energy at our Headquarters in August 2022, and plan to introduce solar power at our stores)
2. Physical risks and opportunities
Out of the identified physical risks and opportunities, the Company views direct damage to stores and decreasing sales due to the intensification of storms and floods arising from global warming as having a particularly significant impact. Given that extreme weather events such as typhoons and localized torrential rains are already occurring more frequently, these trends will intensify especially in a scenario of significant temperature rise as global warming progresses.
To quantitatively clarify such impact on the Group, we prepared estimates by referring to the changes in the flood frequency in the case where the temperature rises by 2℃ presented in the “Recommendations for appropriate flood control plans considering climate change” published by the Ministry of Land, Infrastructure, Transport and Tourism. Our estimates are based on the assumption that the temperature in 2050 will be 2℃ higher than now as the Fifth Assessment Report of the IPCC estimates in the 4℃ scenario (RCP8.5), in which the world’s mean temperature between 2046 and 2065 will be an average of 2℃ higher than between 1986 and 2005.
Assumed impact on the Group in 2050
The table below can be scrolled horizontally.
| (1) Past flood damage (thousand yen) |
(2) Flood frequency in the case where the temperature rises by 2℃ | Estimated flood damage (1) × (2) (thousand yen) |
|---|---|---|
| 1,100,000 | Double | 2,200,000 |
- Preconditions for estimates
- Past flood damage: Damage of approximately 600 million yen to merchandise and facilities from floods in 2019 (estimated based on actual insurance claims paid out), and a decrease of approximately 500 million yen in sales due to business suspension (estimated based on sales amount of temporary closed stores in the previous year), resulting in assumed total damages of approximately 1.1 billion yen.
- Flood frequency in the case where the temperature rises by 2℃: According to the “Recommendations for appropriate flood control plans considering climate change,” the precipitation and flood frequency when the temperature rises by 2℃ will be 1.1 times and approximately double, respectively.
In the case of a 4℃ rise in temperature by the end of the 21st century as described in RCP8.5, precipitation and flood frequency are estimated to be 1.3 times and approximately four times, respectively.
As a result of the estimation, we recognize the risks to be approximately 2.2 billion yen in damage to merchandise and facilities, and a decrease in sales.
- Countermeasures against risks
- Based on our experience from past disasters, we set up disaster prevention facilities (such as water sealing plates) and take other steps to prevent and mitigate damage at high-risk stores. Specifically, we have a track record of effectively preventing flood water from flowing into stores with water sealing plates in the Kyushu region, when torrential rains caused by a linear rainband occurred in August 2021. We also use flood hazard maps to check flood risk before opening new stores, and use our findings to implement measures such as raising ground and shop floor levels. Merchandise and facilities at all stores and offices are covered by property insurance, and compensation will be made within the range of the insurance amount in the event of damage.
K’s Denki Group 2050 Carbon Neutrality Transition Plan
(formulated on March 21, 2024)
The K’s Denki Group considers responding to climate change to be a key management issue.
To create medium- to long-term corporate value and contribute to achieving a sustainable society by limiting the global temperature rise to 1.5℃, we have set and are working toward the following GHG emissions reduction targets.
K’s Denki Group emissions reduction targets
The table below can be scrolled horizontally.
| Target year | Target |
|---|---|
| FY2031 | 50% reduction of Scope 1 and 2 GHG emissions (compared with FY2014) |
| FY2051 | Carbon neutrality of Scope 1 and 2 GHG emissions |
K’s Denki Group 2050 Carbon Neutrality Transition Plan
To date, we have focused our efforts on saving energy (streamlining), which is demonstrated by the fact that our Scope 1 and 2 emissions have decreased by 7.3% since FY2014 even as we grew 32% from 415 to 546 stores. We plan to pivot to introducing renewable energy in an effort to meet our interim target for FY2031 and achieve carbon neutrality by FY2051.
The table below can be scrolled horizontally.
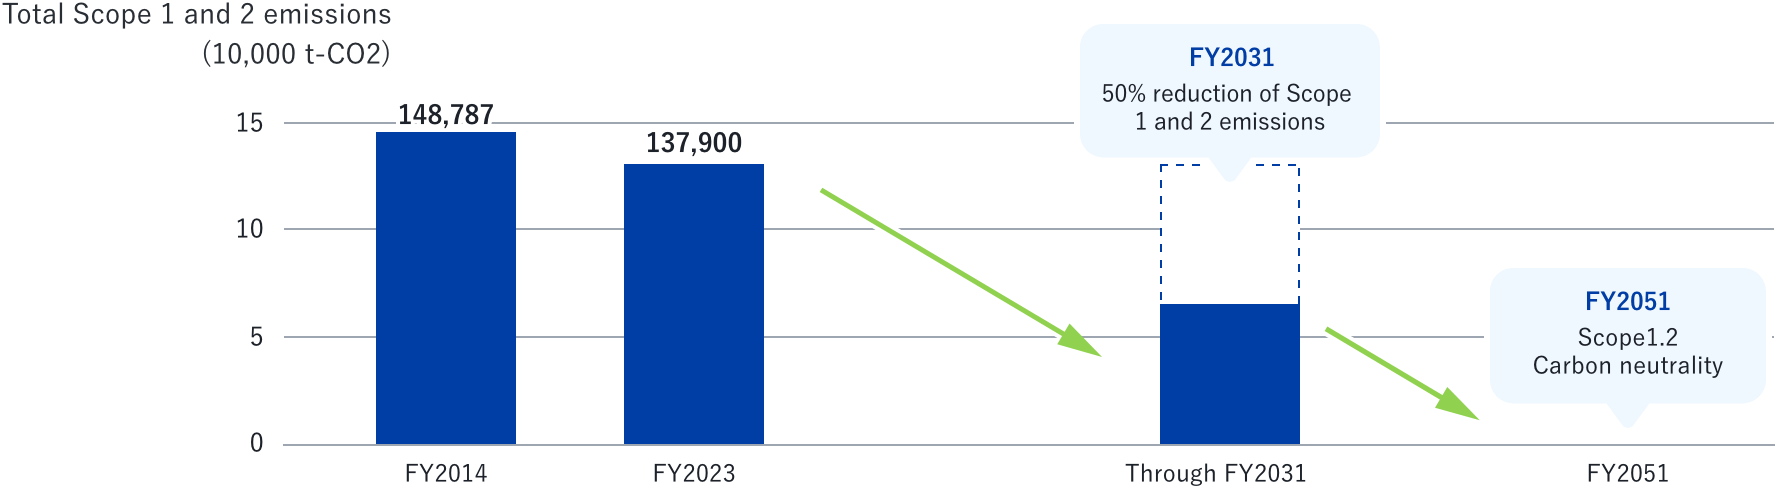
| Time frame | Before plan (actual) | Short term | Medium term | Long term | |
|---|---|---|---|---|---|
| FY2014 | FY2023 | Through FY2027 | Through FY2031 | FY2051 | |
| Scope1.2 emissions (t-CO2) |
148,787 | 137,900 | FY2031 50% reduction compared with FY2014 |
Scope1.2 Carbon neutrality |
|
| Targeted countermeasures |
Promote energy saving: Streamlining
Promote use of renewable energy: Phase 1
Promote use of renewable energy: Phase 2
|
||||
Metrics and Targets
Metrics used for management of climate-related risks and opportunities
The Company uses metrics for management of climate-related risks and opportunities: Scope 1 (emissions associated with the use of fuels), and Scope 2 (emissions associated with the use of electricity and heat supplied by other parties). With regard to Scope 3 (emissions associated with the entire supply chain), the Company started preparing estimates in FY2022 for seven categories, and prepared estimates in FY2023 for all categories excluding two unrelated categories.
GHG emissions: The Group’s actual Scope 1 and 2 emissions (market standards)
The Group’s total Scope 1 and Scope 2 emissions in FY2024 were 134,711t-CO2, a reduction of 3,189t (2.3%) compared with FY2023. Compared to FY2021 (total Scope 1 and Scope 2 emissions of 158,028t), this represented a reduction of 23,317t (14.7%).
Scope 1 and 2 emissions (Scope of estimates: All Group offices and stores)
The table below can be scrolled horizontally.
| Scope 1 emissions (t-CO2) | Scope 2 emissions (t-CO2) | Total of Scope 1 and 2 emissions (t-CO2) |
|
|---|---|---|---|
| FY2023 | 20,492 | 117,408 | 137,900 |
| FY2024 | 18,975 | 115,736 | 134,711 |
| Increase (decrease) | (1,517) | (1,672) | (3,189) |
| Percentage increase (decrease) | (▲7.4%) | (▲1.4%) | (▲2.3%) |
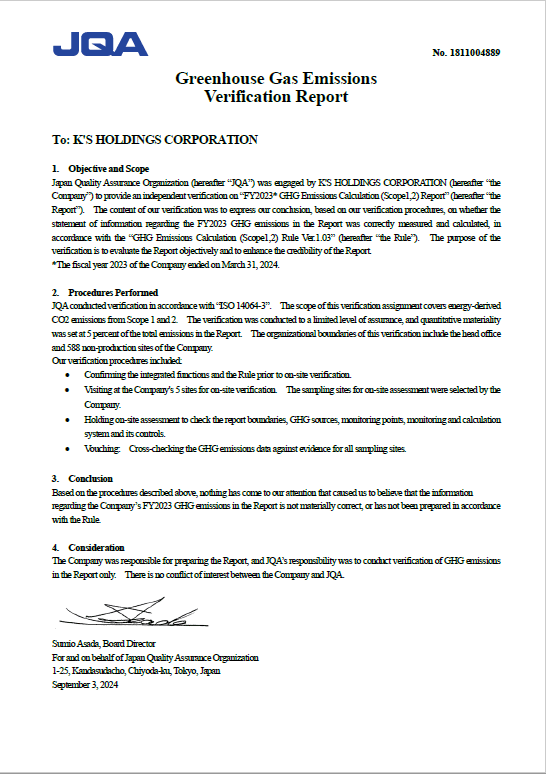
Third-party verification of the Group’s Scope 1 and 2 emissions
Since FY2023, the Group has entrusted third-party verification on Scope 1 and Scope 2 emissions to Japan Quality Assurance Organization (JQA), and obtained assurance on our data. The results of the verification provided assurance on our data. The Group will continue to work toward ensuring the objectivity of disclosed results and improving reliability.
GHG emissions: Results of provisional calculation for the Group’s Scope 3 emissions
The Group’s total Scope 3 emissions in FY2024 were approximately 1.061 million t-CO2. By category, “11. Use of merchandise sold” produced approximately 7.82 million t-CO2 of emissions, followed by approximately 2.58 million t-CO2 for “1. Purchased merchandise and services,” with the total of both categories accounting for 98% of emissions in all categories.
Due to the significant impact of Category 11 in particular, in reducing the Group’s Scope 3 emissions, we consider it effective to increase the sales composition ratio of merchandise with higher energy-saving performance. We also consider it important to focus efforts on air-conditioners in particular, which has the highest sales composition ratio in Category 11 (sales composition ratio of air-conditioners in Category 11: Approx. 67%).
The Company will continue to put effort into promoting the sale of air-conditioners with high energy-saving performance.
Scope 3 emissions estimation results
The table below can be scrolled horizontally.
| Category | Emissions (t-CO2) | ||
|---|---|---|---|
| Upstream | 1 | Purchased merchandise and services | 2,584,109 |
| 2 | Capital goods | 54,105 | |
| 3 | Fuel- and energy-related activities excluded from Scope 1 and 2 | 22,550 | |
| 4 | Transportation/delivery (upstream) | 48,658 | |
| 5 | Waste emissions from business activities | 22,669 | |
| 6 | Business trips | 880 | |
| 7 | Commuting of employees | 12,437 | |
| 8 | Lease assets (upstream) | Included in Scope 1 and 2 | |
| Downstream | 9 | Transportation/delivery (downstream) | Included in Category 4 |
| 10 | Processing of merchandise sold | Irrelevant | |
| 11 | Use of merchandise sold | 7,822,954 | |
| 12 | Disposal of merchandise sold | 33,770 | |
| 13 | Lease assets (downstream) | 5,488 | |
| 14 | Franchises | 542 | |
| 15 | Investments | Irrelevant | |
| Total | 10,608,162 | ||
Targets used for management of climate-related risks and opportunities
The Company has consistently endeavored to reduce emissions per unit of sales area based on Scope 2 emissions since FY2008, and our efforts have successfully saved energy and streamlined operations to the point that we reduced emissions 69.6% from FY2008 to FY2023.
As an additional initiative, in March 2024, we established a medium- to long-term reduction target toward carbon neutrality of Scope 1 and 2 emissions by 2050 to create medium- to long-term corporate value and contribute to achieving a sustainable society by limiting the global temperature rise to 1.5℃, as stated in our strategy.
As an interim target, we are aiming for a 50% reduction in Scope 1 and 2 emissions by FY2031 compared with FY2014.
We will continue our streamlining efforts, which have borne fruit to date and include installing LED lighting systems and introducing building and energy management systems (BEMS) in our stores, and also plan to introduce renewable energy in an effort to reduce emissions.
Targets used for management of the Group’s climate-related risks and opportunities
The table below can be scrolled horizontally.
| Metric | Target year | Target |
|---|---|---|
| GHG emissions (Scope1.2) |
2050 | Carbon neutrality (Scope 1 and 2) |
| 2030 | 50% reduction of Scope 1 and 2 emissions (compared with FY2014) |
Baseline year figures and targeting mission
The table below can be scrolled horizontally.
| Metric | Baseline year | Target year | |
|---|---|---|---|
| FY2014 | FY2031 | FY2051 | |
| Scope 1 and 2 emissions (t-CO2) | 148,787 | 74,393 | Carbon neutrality |
Going forward, we will make efforts to achieve our Scope 1 and 2 emissions reduction targets and work with the Consumer Electronics Distribution Organization (an industry association) and suppliers to achieve carbon neutrality of Scope 3 emissions throughout the entire supply chain.
Future initiatives
The Company continues to endorse the 2021 TCFD recommendations, and also participated in the Japan Climate Initiative in September 2023 and declared our support for the declaration of “joining the front line of the global trend for decarbonization from Japan.” With a view to realizing a decarbonized society, we will continue to work on reducing emissions from our stores and offices as a home appliance/electronics retailer, and to put effort into promoting the sale of energy-saving products so as to contribute to reducing emissions from the household sector. Through these initiatives, the Company aims to continue responding proactively to climate-related risks, which, in turn, will help us capture growth opportunities.